
- Shannon entropy expresses the amount of information needed to describe what happens in a system when the probabilities of all its possible outcomes are known. In other words, it measures how uncertain the system is. If the probabilities of the different outcomes are similar, entropy is high because more information is required to determine which event will occur. Conversely, if one outcome is much more likely than the others, entropy is low since the result is easier to anticipate.
- Table 1 qualitatively illustrates the relationship between liquidity structure and the entropy value.
| Market type | Characteristics | Entropy |
| Liquidity | Many buy and sell orders available at nearby prices. | High |
| Illiquidity | Few orders; low volume at the current price. Executing an order can move the price. | Low |
Table 1: Qualitative relationship between liquidity and entropy in the order book.
Usefulness of entropy
- In general, it allows quantifying the degree of uncertainty or dispersion in the liquidity distribution within the order book. A high value indicates that liquidity is relatively evenly distributed across several price levels, suggesting a more stable market and less vulnerability to sudden changes. In contrast, low entropy reveals that much of the liquidity is concentrated in a few levels, which may imply greater fragility to large orders or unexpected events.
Formal definition
- Shannon entropy is defined as
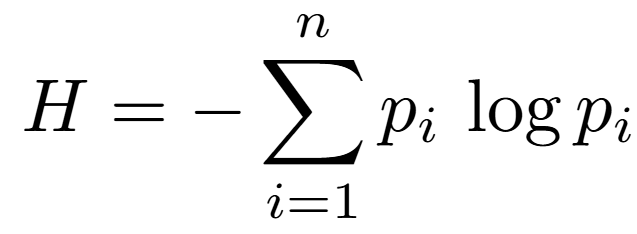
(in this work, a base-10 logarithm is used for simplicity), where the probabilities p_i are modeled, in this study, based on the monetary value weighted by order book level:
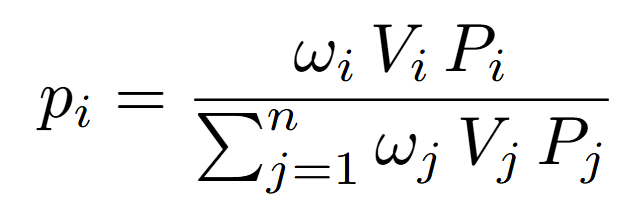
with V_i the available volume at level i, P_i the corresponding price, and omega_i a weighting factor that adjusts the relevance of each level (for example, according to proximity to the mid-price or other microstructure criteria).
To facilitate interpretation, a normalized version is used:
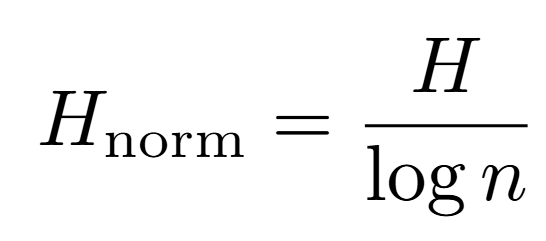
which ensures that H_norm ∈ [0,1]. Under this convention, values close to 1 indicate a more homogeneous liquidity distribution (greater operational liquidity), while values close to 0 reflect concentration in a few levels (lower liquidity).
Analysis hypothesis
- This study compares two market environments with different liquidity levels. The hypothesis states that one of them exhibits a more uniform order distribution than the other. The results shown in the figure confirm this hypothesis.
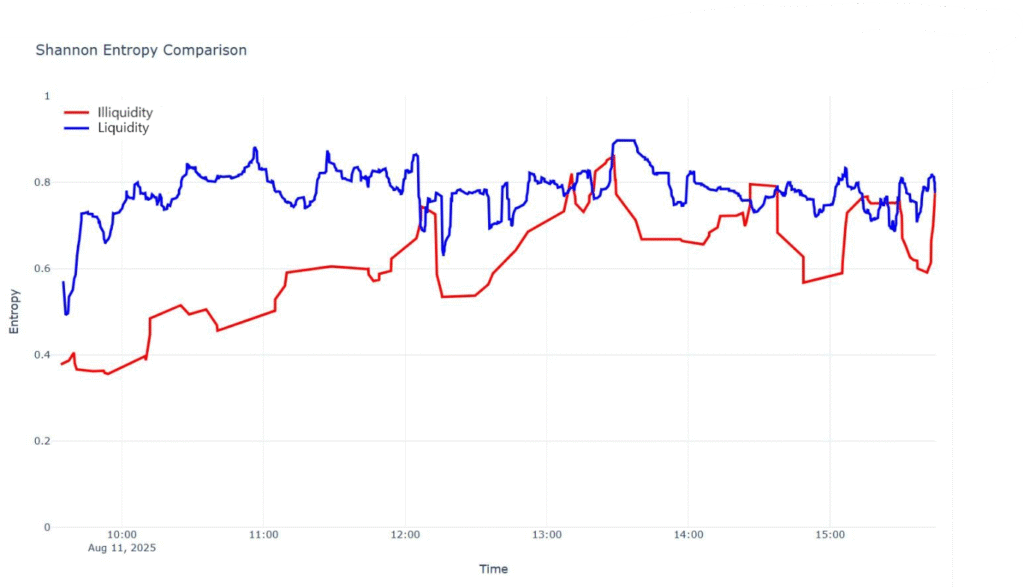
Figure 1: Evolution of normalized entropy in two market environments with different liquidity. The results show that, in the liquidity environment, the value of H approaches 1, reflecting a more homogeneous distribution of orders in the book. In contrast, in the illiquidity environment, the value of H is significantly lower, indicating a concentration of orders at a reduced number of price levels.